There are several key differentiators which separate SAP Analytics Cloud from other similar tools:
- Machine Learning/AI-driven Data Discovery significantly reduced the time for users to move from insight to action.
- One integrated solution for business intelligence, planning, and augmented/predictive analytics
- Various live connection options which allow real-time access to critical data sources on-premise and in the cloud.
Lets look at the automated data discovery functionalities in SAC powered by Machine Learning technology. There will be a follow up discussing how one can leverage SAC’s integrated functionalities, including Business Intelligence, Planning, and Augmented analytics in an end-to-end scenario.
Intelligent Insights Through SAP Analytics Cloud
SAP Analytics Cloud has changed the way we perform data discovery/self-service reporting. The embedded smart features (Smart Discovery, Smart Insights, Smart Predict, Search to Insight) can help find intelligent insights much faster while reducing human bias in analytics.
Self-service reporting and data discovery are not new to the BI community since many of the traditional BI tools offer this functionality, allowing users to investigate, discover, and build their reports with minimum IT involvement. However, most of these tools are still using a manual approach, meaning users drag and drop the measures and dimensions to build their visualizations, apply filters, and slice and dice the data in ways they think may fit. This approach is not only time-consuming but makes it near-impossible to see correlations between multiple data elements and visualizations.
For example, let’s say you want to know why a product’s revenue has dropped in recent months? The typical approach is to pick the measure you are interested in (revenue) and then create as many visualizations on the dimensions as you think might have contributed to the drop in revenue. Is it related to promotion? Pricing? Cost? There may be a lot of influencing factors, and with the manual approach, you would have to create multiple charts and assemble them all in a dashboard.
Even with all that effort, you most probably will not have a complete picture with answered questions. Which of the influencing factors contributed most to the drop in revenue? What type of action needs to be taken? It is not easy to interpret the information provided in the charts and get the answers we seek.
Automating Data Discovery
With SAP Analytics Cloud’s automated data discovery, this type of interpretation is a thing of the past. The program allows for:
- Identifying relationships and patterns missed through manual discovery
- Identifying key influencers and contributors to a KPI within minutes

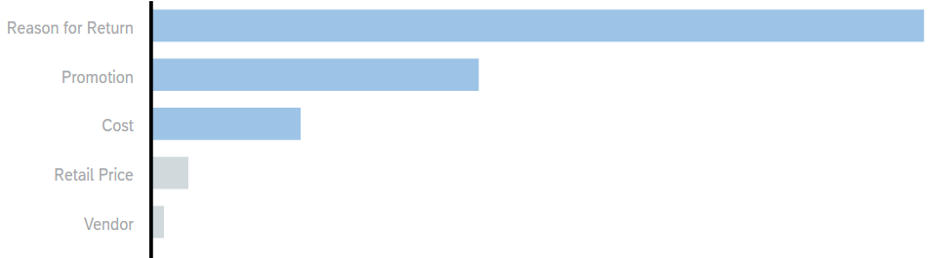
As shown in the graph above, leveraging the Smart Discovery and the Smart Insights capabilities in Analytics Cloud can help identify a list of contributing columns to revenue with the click of a button.
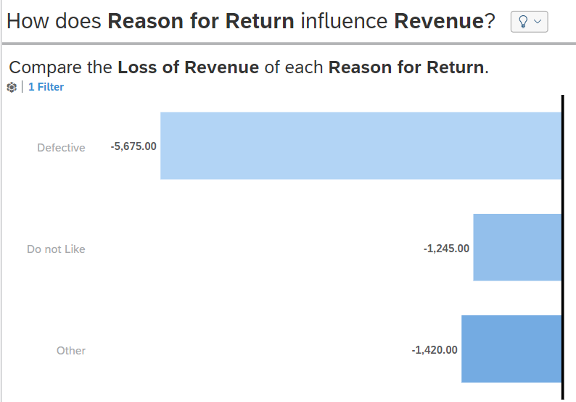
In our example, we found customer “returns” are the main reason for the decrease in revenue for this product. To investigate this further, we want to find out what caused the high return rate.
Traditionally, a user would have to manually pivot the data to identify the member from each dimension that contributed to the high number of returns. Instead of taking the manual approach, we used Smart Insights to identify the top reason for the returns. It turned out “defective product” was the main reason for customer returns, which caused a significant loss of revenue. Smart Insights further identified customer returns (defective products) increased significantly in March compared to previous months, and the defective products mainly originated from Supplier C.
At this point, we have enough information to take proper action. Smart Insights can be a significant time-saver because machine-learning technology does the work for you.
User-Friendly Search in SAP Analytics Cloud
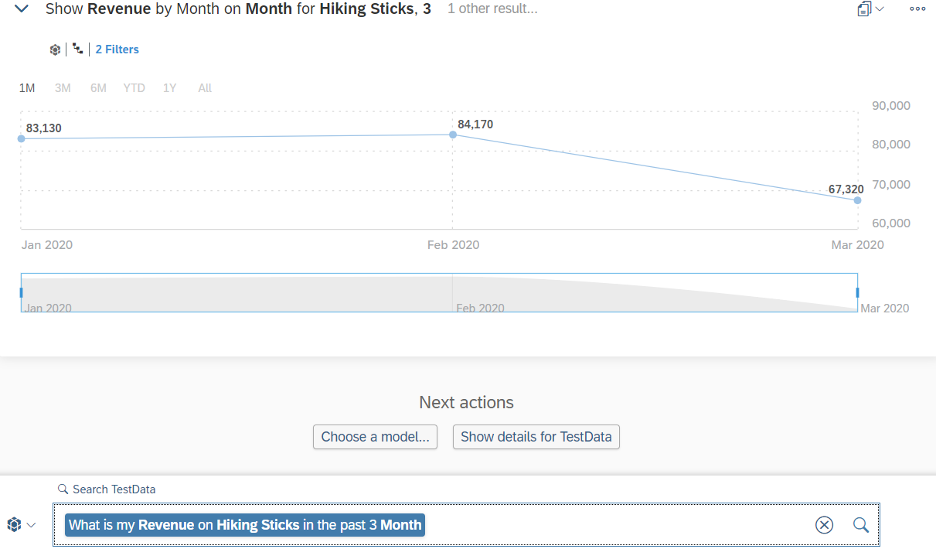
The other key functionality of the embedded smart feature is Search to Insight. Search to Insight leverages natural language processing, allowing for run analysis on an ad-hoc basis and gaining instant insight by simply querying a business question. In some cases, users need a quick answer on their data. For example: What is the total sale for my department in the previous week? How are my actual sales compared to my budget/plan? Instead of manually building the visualization to find the answer, a user can simply type the question in Search to Insight and gain the answers instantly.
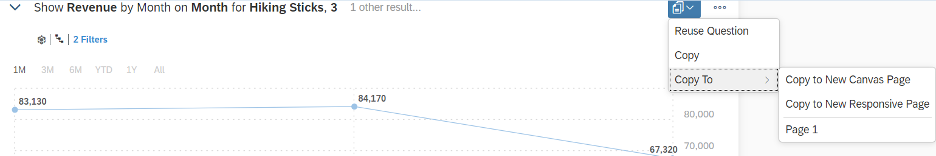
The auto-generated visualization created from Search to Insight can be included in other reports and dashboards to save time when building stories by simply copying the visualization into a new or existing story.
With SAP Analytics Cloud’s embedded smart features, the overall time it takes to analyze data and to gain valuable insights is reduced significantly, leaving the user with more time to focus on high-value business activities.