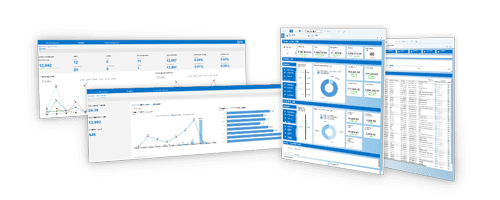
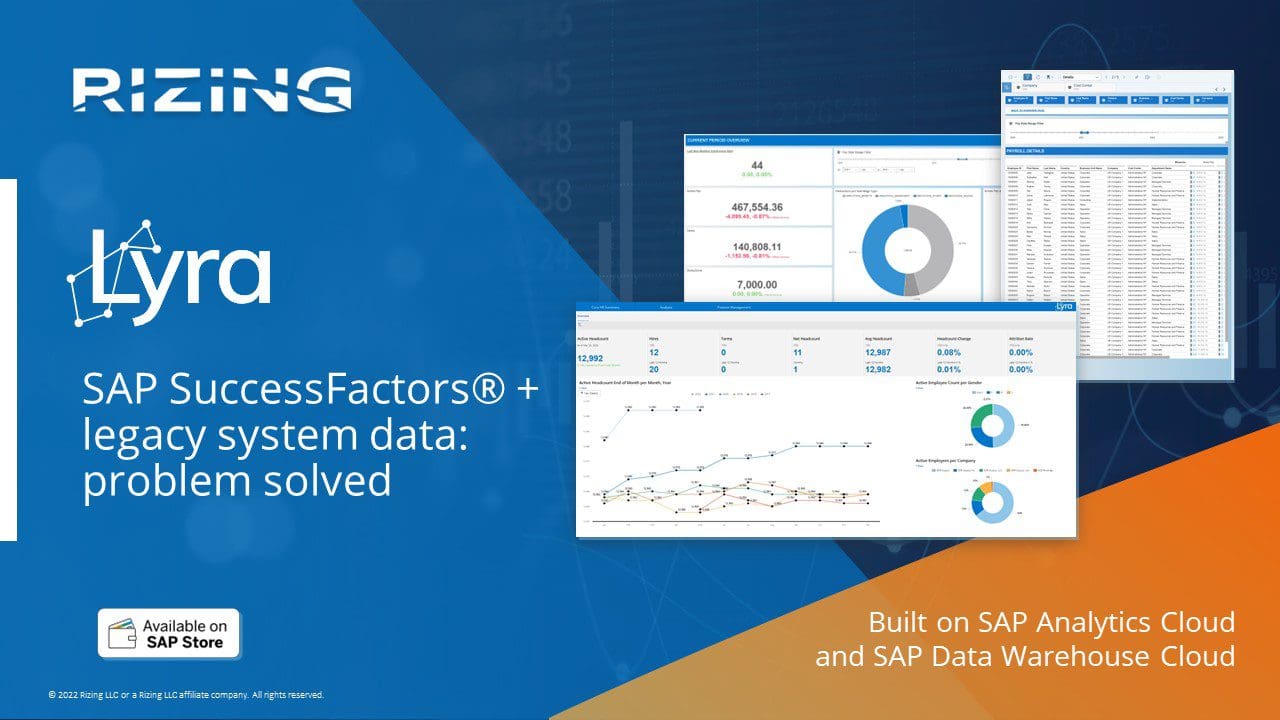
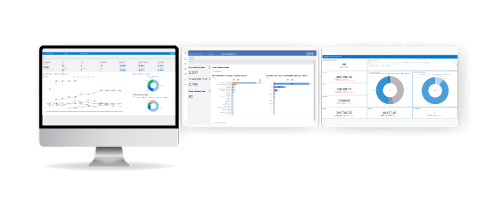
Lyra from Rizing is the only people analytics solution that aggregates live SAP SuccessFactors data with other data sources to generate intelligible and actionable reports and forecasts.
The Reality
Today’s labor market is tight. HR teams are busy fielding questions from executives trying to get past the status quo and meet unyielding demands for corporate growth.
Questions like:
- What’s our headcount?
- How diverse are we?
- How many people are we currently hiring?
- What’s our current payroll?
- What percentage of our workers are remote?
More than Measuring
We’ve all heard the Peter Drucker quote: “If you can’t measure it, you can’t improve it.”
But it’s not just the measuring.
Capturing data is easy. We capture gigabytes of it each day.
How do we process that data, combine with data from the old HR system, and summarize it all into reports that visualize measurements in ways that we immediately understand?
And while we’re at it, how do we keep that data private, secure, and compliant?
Lyra from Rizing Provides SuccessFactors Analytics
Lyra is Rizing’s people analytics reporting application that helps users and businesses make informed, data-driven decisions.
Modular and scalable, Lyra is a user-focused solution pre-configured with common KPIs, reports, and dashboards. It features centralized metrics definitions to ensure accuracy and efficiency in creating, delivering, and using data for decision making.
Powered by SAP Analytics Cloud and SAP Data Warehouse Cloud, Lyra enables you to include and aggregate live and historical data with reports viewable on any device. It’s SAP approved and available on the SAP Store.
Lyra Modules Include:
Core HR
Provides critical insights into headcount, hire, attrition, span of control, etc.
Payroll
Allows Synchrony Payroll clients to aggregate payroll results for different geographic regions and timeframes.
Recruiting
Shows active requisitions, recruiter workloads, recruiting and recruiter efficiency, offer acceptance trends, and difficult-to-fill jobs.
 Performance and Goals
Shows your corporate goal planning, objectives setting, and performance processes.
Learning
Reports on organizational learning activity and calculates key learning metrics such as how many courses have been assigned per employee, completed and overdue courses, top courses based on the number of completions, etc.
Compensation
Shows compa-ratios, average salaries, total compensation, variable pay, gender pay gap, and more – both as an overall organization and per job level, business unit, department, and others.


 Performance and Goals